Research highlights: mid-year wrap up
- Published:
- July 2019
- Analyst:
- Phocuswright Research

We're halfway through 2019 and the global Phocuswright analyst team continues to produce reports at an unprecedented rate. It's a perfect time to highlight the trends and data that shape our research and reflect the ever-evolving dynamics of online travel. This is what's defining the global travel market in 2019. For data from each topic, continue reading below the graphic.
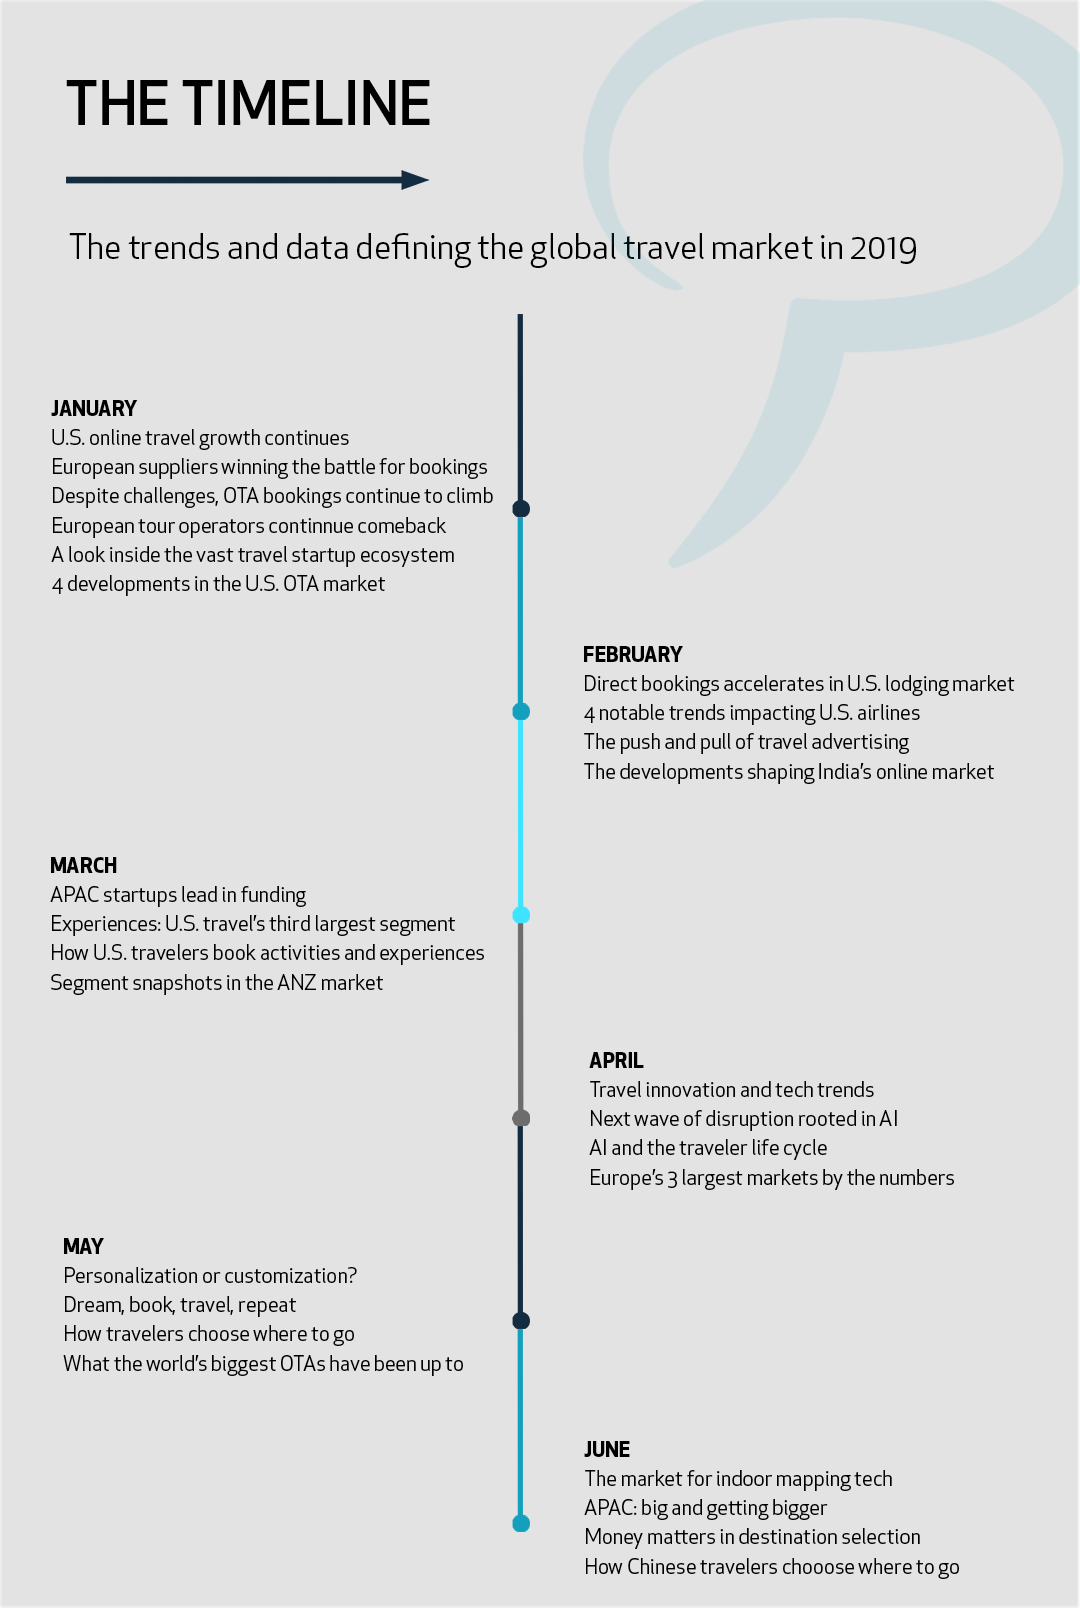
(Click image to view a larger version.)
January
U.S. online travel growth continues to outpace the overall market: The U.S. travel market grew a healthy 5% in 2018, with gains remaining stead in 2019. By 2022, total gross bookings will have increased to $441 billion.
Europe by the numbers: Suppliers are winning the battle for online bookings, with 66% of bookings made through supplier websites/mobile apps and 34% through OTAs.
Despite challenges, OTA bookings continue to climb in Europe: Despite the challenges, OTA bookings continue to climb in Europe. In 2018, the supplier-OTA channel reached €47.9 billion. Modest growth is projected for the next several years, as OTA bookings grow at roughly half the pace of the supplier-direct channel.
European tour operators continue comeback despite competition: The European tour operator segment continues its comeback into 2019. Gross bookings grew 4% to €55.5 billion in 2018, with similar growth expected over the next several years.
From investors to incubators: A look inside the vast travel startup ecosystem: The travel startup ecosystem is backed by more than 80 travel-focused accelerators, incubators, early-stage investors and entrepreneur support programs.
4 key developments that keep the U.S. OTA market exciting: The U.S. duopoly stands strong (Expedia and Booking), APAC remains a coveted market with U.S. based hopefuls continuing to make inroads to expand product offerings, a flurry of Activities activity continues to dominate headlines, and voice continues to be tested in all stages of the traveler life cycle.
February
Direct booking accelerates in U.S. lodging market: The verdict is in: Hotel loyalty rates are paying off – hotels are catching up to OTAs in terms of online distribution and OTA sales growth falls to single digits after years of double-digit growth.
4 notable trends and stories impacting the U.S. airline segment: The most notable stories center around merchandising/unbundling/re-bundling, growth of ancillaries, favorable distribution costs through metasearch, and NDC coming (slowly) to an airline near you.
The push and pull of travel advertising: U.S. ad spend reached $7.6B in 2018 and European ad spend will reached $4.6B – rising right alongside revenue growth.
The need-to-know developments shaping India's online market: Air accessibility – and affordability – is the biggest ongoing development in India. Long-tail hotel standardization has kicked in, and online sales have erupted. MakeMyTrip leads the OTA space and according to PhocusWire, OYO has become “the online travel [brand] of the moment”.
March
APAC startups lead in funding: funding to travel startups is plateauing, and late-stage funding rounds continue to concentrate into emerging and established category leaders. In the last 10 years or so, travel startups in Asia Pacific raised the most funding at US$6.1B, followed by North America at US$4.3B and Europe at US$3.7B (check report methodologies on why we exclude funding to companies like Airbnb).
U.S. travel's third-largest segment by size: Experiences: Travel activities account for 8% of U.S. travel gross bookings and the segment comes in third by size behind hotels and flights. The U.S. travel activities market totaled $34 billion in 2018, and growth is outpacing the total travel market.
How U.S. travelers book activities and experiences: Across most activity categories, more than three in four activities booked in-destination happened on the day of or day before the activity. The reasons that activities are booked last minute can vary by activity type, but the top reason across activity types is simply because the traveler is not a planner.
Segment snapshots in the Australia-New Zealand travel market: With online penetration of 44% in 2018, ANZ is one of the most mature online travel markets in Asia Pacific, though offline travel agencies remain a critical channel for complex leisure itineraries and packages in addition to business travelers.
April
2019 travel innovation and technology trends: Highlights include NDC and ONE Order, personalization vs. Customization, AI’s come up, on-demand micro-hospitality, edge computing, voice, biometrics and more.
Next wave of travel disruption rooted in AI: AI is currently being integrated into every conceivable corner of the industry, and it is beginning to shift industry dynamics, affording new opportunities for travel brands to rethink business processes, optimize advertising, increase customer engagement, improve customer support and so much more.
AI and the travel life cycle: Applications of AI continue to influence “search, shop, buy”, transit, in-destination and analysis.
By the numbers: Europe's 3 largest markets: A look at percentage of adults who travel, average annual spend, and trip frequency for France, Germany and the U.K.
May
Personalization or customization?: Three fundamental approaches are employed to tailor the user experience based on both explicit traveler preferences and inferred signals derived from past performance: customization, individualization and personalization.
Dream, book, travel, repeat.: A quarter of U.S. destination selectors say they actively research new trips at least once a month. They know where they want to go, like to revisit destinations, feel wanderlust for new destinations and more than two-thirds start booking at least a month ahead.
How travelers choose where to go: Different travel personas impact how and when to book, as varying socio-economic, lifestyle and cultural influences impact every decision.
What the world's biggest OTAs have been up to: Growth rates in the world of public online travel once again slowed in 2018, but remained in double-digit territory, rising more than twice as fast as the total global travel market.
June
The market for indoor mapping tech: Indoor mapping technology has rapidly evolved over the last several years, and airports are some of the prime beneficiaries. In the U.S., an estimated US$70 billion will be spent to modernize aging aviation infrastructure at over 50 airports in the coming years.
APAC: Big and getting bigger: Aggregated total gross bookings in 13 markets reached US$418.1 billion in 2018, up 7% year over year. Burgeoning domestic travel demand, especially in China, India, Indonesia and Malaysia, supported this growth, placing the region well ahead of both the U.S. and Europe.
Value proposition: Money matters in destination selection: The amount travelers are willing to spend on trips varies with the personal value they put on travel, but price is a central consideration to travelers overall. In many cases, it can spark a traveler to seriously consider taking a new trip.
How Chinese travelers choose where to go: For many travelers around the world, beachgoers and city explorers were the highest-ranking traveler personas but Chinese travelers say nature and food are their biggest travel interests. More than two in five designate themselves as a nature lover, and one in three as a foodie. In no other market but China did these two personas rank in the top three.
Destination selection in 5 major travel markets: Travelers from these markets only take a few leisure trips a year, but travel is rarely far from their minds. Mobile devices mean that information is always at their fingertips, and travelers are eating it up. Destinations and travel marketers need to consistently entice travelers to remain top of mind.
Looking for more?
Check out our free downloads, explore our research publications, subscribe to Open Access to unlock every report for your entire company, or contact us for more information.

More Research Insights


