Search our vast library for research across the entire travel, tourism and hospitality industry.
Not an Open Access subscriber? Phocuswright's Customer Concierge team can customize a research bundle to fit your needs. Find out more here.
243 Results
(1)(2)(1)(1)(1)/interactive_Scandinavia-Interactive-Charts.png?tr=w-337%2Ch-257%2Cfo-auto)
Interactive ChartsScandinavia Interactive Charts
Published: May 2025
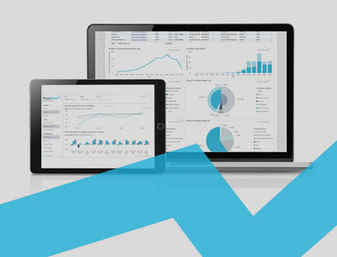
Tap into the most recent data on the Scandinavia travel market. Data is presented in a visually...
Interactive Charts
(1)(2)(1)(3)/interactive_Mexico-Interactive-Charts.png?tr=w-337%2Ch-257%2Cfo-auto)
Interactive ChartsMexico Interactive Charts
Published: September 2025
Tap into the most recent data on the Mexico travel market. Data is presented in a visually...
Interactive Charts
(1)(3)/interactive_Colombia-Interactive-Charts.png?tr=w-337%2Ch-257%2Cfo-auto)
Interactive ChartsColombia Interactive Charts
Published: September 2025
Tap into the most recent data on the Colombia travel market. Data is presented in a visually...
Interactive Charts
(1)/interactive_Chile-Interactive-Charts.png?tr=w-337%2Ch-257%2Cfo-auto)
Interactive ChartsChile Interactive Charts
Published: September 2025
Tap into the most recent data on the Chile travel market. Data is presented in a visually interactive,...
Interactive Charts
(1)/interactive_Argentina-Interactive-Charts.png?tr=w-337%2Ch-257%2Cfo-auto)
Interactive ChartsArgentina Interactive Charts
Published: September 2025
Tap into the most recent data on the Argentina travel market. Data is presented in a visually...
Interactive Charts

Interactive ChartsTravel Startups Interactive Database
Published: February 2026
Phocuswright has tracked the travel startup landscape for well over a decade. During this time, the...
Interactive Charts
(1)(2)(1)(1)/interactive_Italy-Interactive-charts.png?tr=w-337%2Ch-257%2Cfo-auto)
Interactive ChartsItaly Interactive Charts
Published: May 2025
Tap into the most recent data on the Italy travel market. Data is presented in a visually interactive,...
Interactive Charts
/interactive_France-Interactive-Charts.png?tr=w-337%2Ch-257%2Cfo-auto)
Interactive ChartsFrance Interactive Charts
Published: May 2025
Tap into the most recent data on the France travel market. Data is presented in a visually...
Interactive Charts
/interactive_German-Interactive-Charts.png?tr=w-337%2Ch-257%2Cfo-auto)
Interactive ChartsGermany Interactive Charts
Published: May 2024
Tap into the most recent data on the Germany travel market. Data is presented in a visually...
Interactive Charts

Interactive ChartsSpain Interactive Charts
Published: May 2025
Tap into the most recent data on the Spain travel market. Data is presented in a visually interactive,...
Interactive Charts


.png?tr=w-400%2Ch-300%2Cfo-auto)


.png?tr=w-400%2Ch-300%2Cfo-auto)


